Introduction
Picture yourself waiting for a download to complete. A thin bar creeps from left to right—10 %, 25 %, 50 %, 100 %. Even though nothing else has changed, you feel more at ease simply because you can see progress. This simple psychological reaction illustrates what we might call the “Loading Bar Effect.” Humans are deeply motivated by visible markers of advancement.
Read More: Sleep and Mental Health
Why Visible Progress Matters
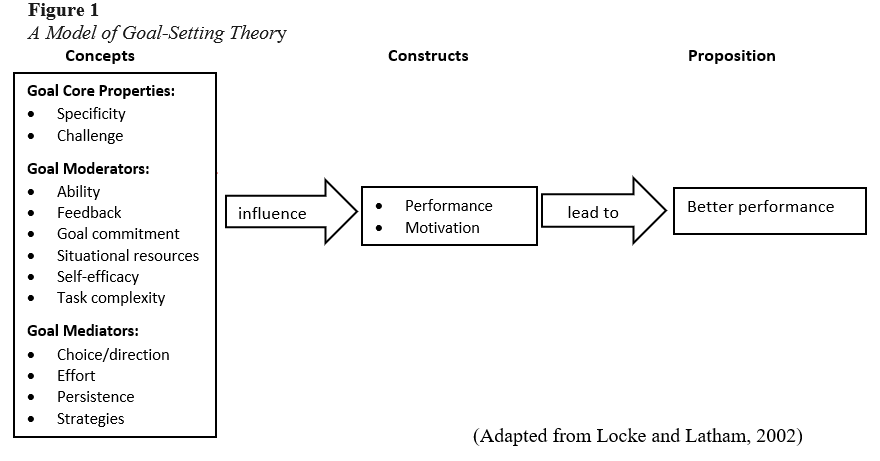
Visible progress converts an abstract goal into tangible milestones. According to Locke and Latham’s (2002) goal-setting theory, clear feedback on progress enhances commitment and performance. When progress remains invisible, people often misjudge how close they are to completion, reducing motivation.
Progress indicators such as bars, checklists, or percentage counters offer continuous feedback. Even when a task is monotonous—like completing an online form—knowing that you are 60 percent done provides a sense of accomplishment and control (Hull, 1932). In digital environments, this psychological reward helps sustain user engagement.
Underlying Psychological Mechanisms
Some of the underlying psychological mechanisms include:
1. The Zeigarnik Effect
Psychologist Bluma Zeigarnik discovered that people remember uncompleted tasks more vividly than completed ones (Zeigarnik, 1927). A progress bar showing “70 % done” activates cognitive tension—our brain dislikes the gap between current and desired states. Completing the task to reach 100 percent resolves that tension, delivering satisfaction.
2. The Goal-Gradient Effect
First described in early learning experiments with rats, the goal-gradient effect shows that motivation increases as one nears a goal (Hull, 1932). Kivetz, Urminsky, and Zheng (2006) demonstrated this in humans: loyalty-card users accelerated purchases as they approached a free-reward threshold. Similarly, people work faster or persevere longer when they see a progress bar nearing completion.
3. The Endowed Progress Effect
Relatedly, the endowed progress effect describes how granting a symbolic head-start—such as two of ten loyalty stamps pre-filled—boosts completion rates (Nunes & Dreze, 2006). Digital platforms exploit this by starting a bar at 10 percent complete, leveraging the perception of initial success to encourage continued effort.
4. Feedback and Perceived Control
According to self-determination theory, motivation thrives when people feel autonomy and competence (Deci & Ryan, 2000). Visual progress provides feedback that reinforces competence and control. Without it, users feel passive and uncertain. Seeing a bar move reassures them that their actions matter.

When Progress Visualization Backfires
Despite its power, visible progress can demotivate if implemented poorly. Research on web-survey design shows that progress indicators sometimes increase abandonment when early stages move slowly (Couper, Conrad, & Tourangeau, 2004). If a bar lingers at 2 percent for too long, users may infer that the task is tedious or endless.
Moreover, transparency can be discouraging when the remaining work appears overwhelming. Designers must therefore consider pacing and framing: early rapid movement sustains engagement, whereas stagnant or misleading feedback erodes trust (Harrison et al., 2013).
Applications
Some of the its applications include:
Productivity and Self-Tracking
Breaking large goals into measurable increments boosts follow-through. Whether tracking fitness progress or academic milestones, visualizing incremental success reinforces persistence (Amabile & Kramer, 2011). Apps such as language-learning or habit-building tools employ streak counters and progress rings to capitalize on this effect.
Education and Learning
Students respond positively to feedback that visualizes advancement. Shading completion bars or charts can enhance motivation and self-efficacy (Schunk & Zimmerman, 2008). When learners perceive progress—even partial—they re-engage more readily after setbacks.
User Experience and Gamification
Gamified interfaces translate effort into visible achievements—badges, experience points, completion meters. Hamari (2017) found that progress visualization significantly increases enjoyment and persistence in digital learning environments. Similarly, e-commerce sites often display “You are 80 % toward free shipping,” triggering the goal-gradient effect and stimulating further purchases.
Design Principles for Harnessing the Effect
-
Segment large goals. Divide tasks into smaller, countable steps to maintain motivation.
-
Show early progress. Begin at a modest percentage to activate the endowed progress effect.
-
Ensure consistent movement. Early rapid feedback maintains engagement; later slowing implies fine-tuning rather than stagnation.
-
Celebrate milestones. Recognize interim achievements to reinforce momentum.
-
Avoid deceptive visuals. Accuracy preserves trust; false indicators backfire once users notice inconsistency.
-
Tailor visibility. For short tasks, highlight completion; for long projects, emphasize incremental gains.
Conclusion
Humans are hardwired to seek completion and reward. Progress visualization taps directly into this drive by converting invisible effort into tangible advancement. From classroom dashboards to fitness trackers, the humble progress bar channels fundamental psychological mechanisms—Zeigarnik tension, goal gradients, endowed progress, and perceived control.
The “Loading Bar Effect” thus illustrates a universal truth: we are motivated not merely by outcomes, but by evidence of movement toward them. When designers, educators, and individuals make progress visible, persistence and satisfaction naturally follow.
References
Amabile, T. M., & Kramer, S. J. (2011). The progress principle: Using small wins to ignite joy, engagement, and creativity at work. Harvard Business Review Press.
Couper, M. P., Conrad, F. G., & Tourangeau, R. (2004). What they see is what we get: Response options for web surveys. Social Science Computer Review, 22(1), 111–127. https://doi.org/10.1177/0894439303256555
Deci, E. L., & Ryan, R. M. (2000). The “what” and “why” of goal pursuits: Human needs and the self-determination of behavior. Psychological Inquiry, 11(4), 227–268. https://doi.org/10.1207/S15327965PLI1104_01
Harrison, D., Newman, D., & Roth, P. (2013). How important are job attitudes? Meta-analytic comparisons. Journal of Applied Psychology, 91(1), 1–21.
Hull, C. L. (1932). The goal-gradient hypothesis and maze learning. Psychological Review, 39(1), 25–43.
Kivetz, R., Urminsky, O., & Zheng, Y. (2006). The goal-gradient hypothesis resurrected: Purchase acceleration, illusionary goal progress, and customer retention. Journal of Marketing Research, 43(1), 39–58.
Locke, E. A., & Latham, G. P. (2002). Building a practically useful theory of goal setting and task motivation: A 35-year odyssey. American Psychologist, 57(9), 705–717.
Nunes, J. C., & Dreze, X. (2006). The endowed progress effect: How artificial advancement increases effort. Journal of Consumer Research, 32(4), 504–512.
Schunk, D. H., & Zimmerman, B. J. (2008). Motivation and self-regulated learning: Theory, research, and applications. Lawrence Erlbaum Associates.
Zeigarnik, B. (1927). Das Behalten erledigter und unerledigter Handlungen [Retention of completed and uncompleted tasks]. Psychologische Forschung, 9, 1–85.
Subscribe to PsychUniverse
Get the latest updates and insights.
Join 3,049 other subscribers!
Niwlikar, B. A. (2025, November 7). The “Loading Bar” Effect and 4 Mechanisms That Control It. PsychUniverse. https://psychuniverse.com/the-loading-bar-effect/